Spaghetti? yes, please…
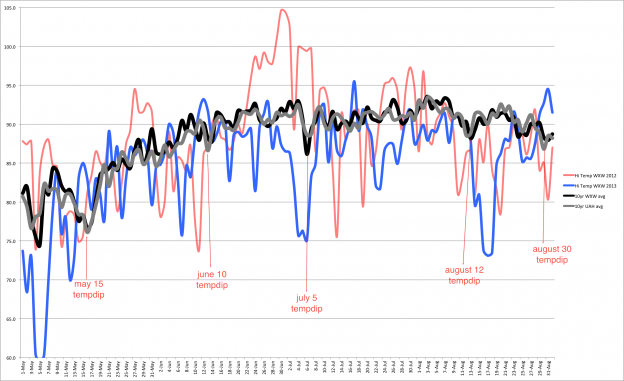
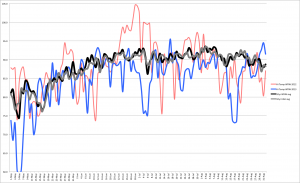
This chart is a representation of average and realized temperatures from May 1 – Aug 31. It looks pretty busy like a plate of spaghetti. But looking at the detail of it, each line (each noodle) represents the temperature in the BHM/Hoover during the time period.
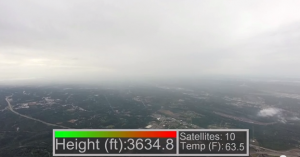
The chart and data include temperatures I’ve gathered on my weatherwalrus wx station (WXWS). It is a Davis Weather Instruments Wireless Vantage Pro2 weather station located in Hoover, AL.
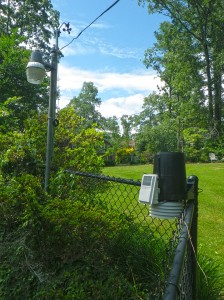
DWI Vantage Pro2 in Hoover
Other data comes from the State Climatology Office in Huntsville, AL (UAH). The data captured by them is at this website. I then basically created a chart in excel based on the recordings. What is seen is a ten year average of temps recognized in this graph as the gray line for the time period indicated, May 1- Aug 31.
The black line is the average temp and exhibits what was recorded on the WXWS for the same time period. If you look, there are some minor differences based on location, elevation, geography, etc. But for the most part, the lines of black and gray are very similar, but not exact.
The blue line indicates the actual temperatures recorded on the WXWS for 2013. The 2013 summer was considered by many in the area to be a lower or cooler than normal. I tend to agree which was the genesis for this analysis.
The pinkish red line indicate the actual temperatures recorded on the WXWS for 2012. These temps were considered by many in the area to be a higher or hotter than normal.
I should have added 2 additional lines of data to show what the NWS collected and what the differences were between the two, graphically. Maybe in my additional spare time, I’ll do that. For now, looking at this chart, it is fairly self-evident the summer of 2013 was cooler overall than 2012…one rabbit hole at a time please.
What was the difference in temperature between years?
Simply looking at the graph one can see a fairly drastic difference between ’12 and ’13 and the visualized difference above or below the ‘norm.’ For example, some of the highest temps in ’12 were at or above 100, while at the same time the next year in ’13, were about 20-25 degrees cooler. And right in the middle of both were the averages.
The difference in numbers will vary based on the day, but doing a quick look at the graph in 2013, there was one time we hit above 95ƒ. Conversely in 2012, there were several times above 95ƒ including periods above 100ƒ for daily high temps. This would pretty much make me ‘feel like’ 2013 was cooler than 2012…or depending on your point of view, ’12 was hotter than ’13.
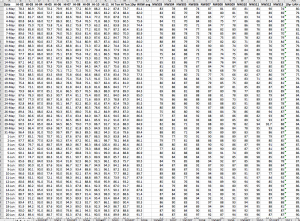
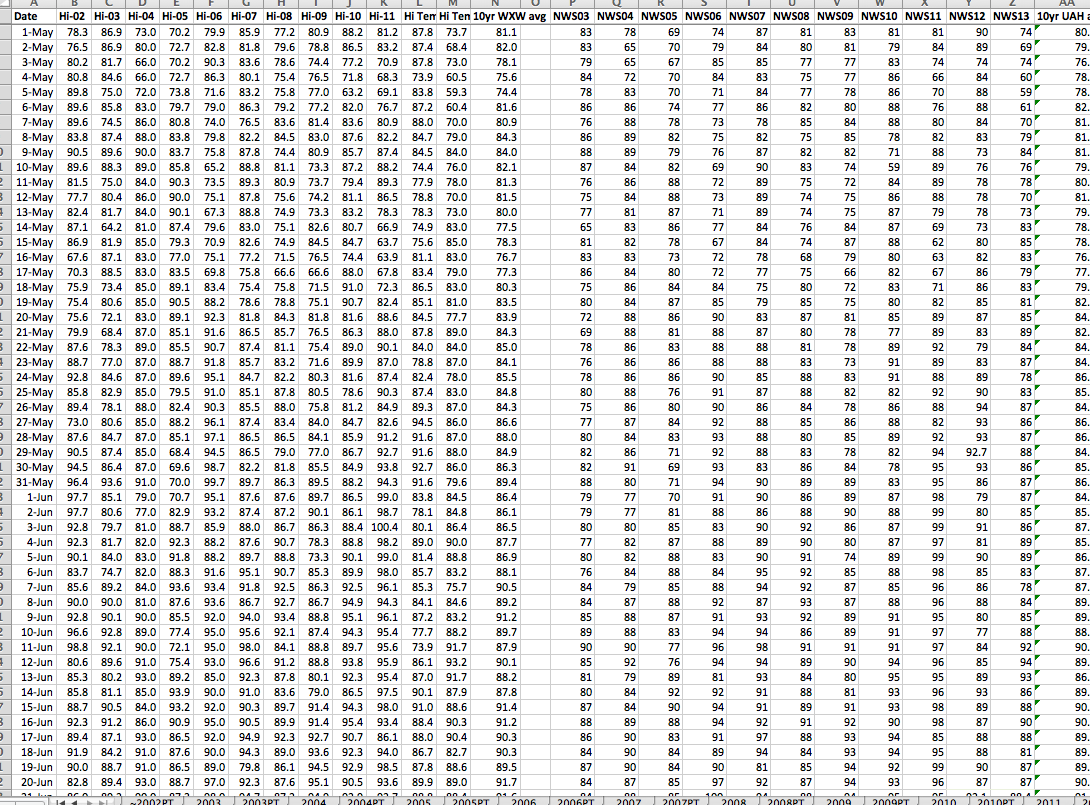
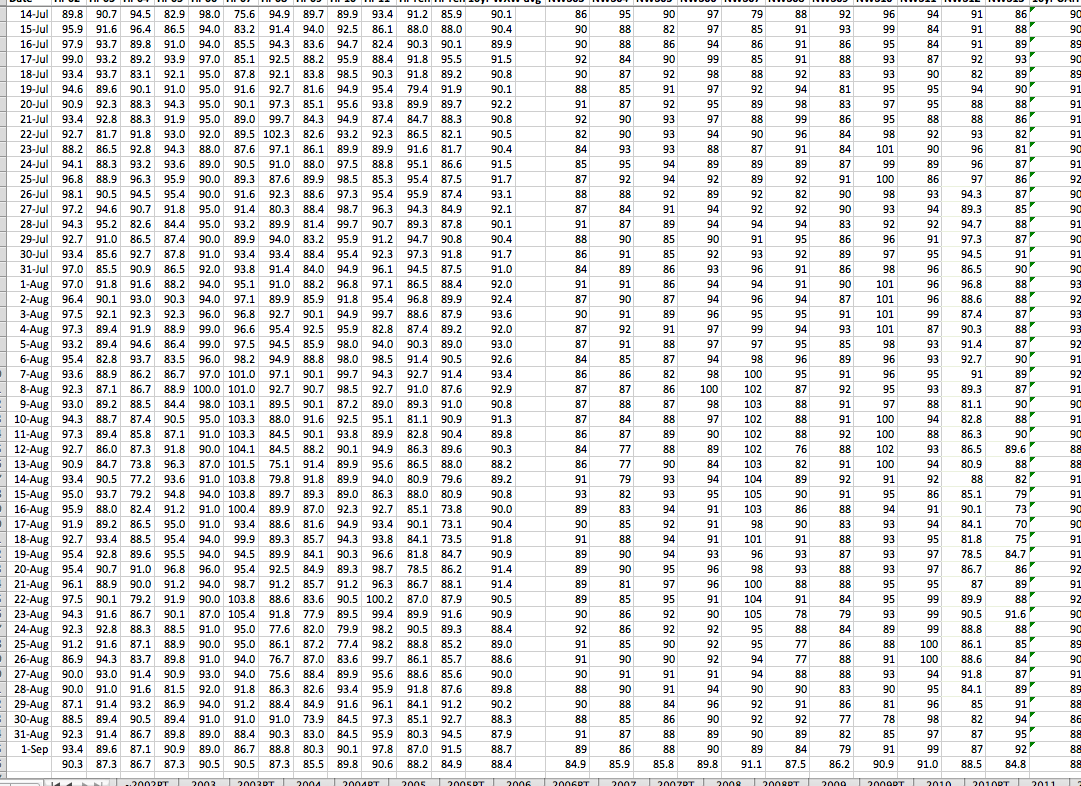
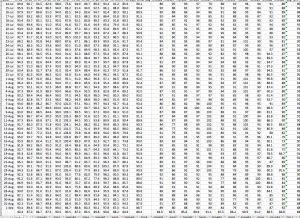
a screen shot of some of the numbers…boring
We could drive down into the numbers and come up with specifics, but the charts do it for us. Or you can look at the bottom of this above image and see some of the numbers.
No, I didn’t bother with humidity or dew point or rainfall.
Yes, I probably should have included these as they affect how things ‘feel’ to us. Cloud cover as it relates to rain is a big variable in temp as it helps keep the sun from heating the earth. In my humble opinion, the sun has more influence on the feeling of ‘heat’ than anything. But there is no question, as ‘feel’ is relative, that humidity is a driving force in how temps feel. Right now, I’m pretty stoked with getting something published. We can overanalyze to the point of nausea later.
more numbers…more analysis…
Now this was pretty cool and unexpected…tempdips explained
My journalism professor would admonish me. I buried the lead. One thing i did notice in this analysis were the occasional ‘tempdips’ in temperature that occur periodically in our average and realized temps. We even just had a tempdip in Hoover/BHM, presumably caused by a relative cold front coming through. This is a part of our May 15ish tempdip.
What do I mean by ‘tempdip?’ If we look at the black and gray lines, our temps have a fairly steady rise through the solstice and even a little afterwards as the sun continues to bake the surface of the earth.
But based on the chart, we should have tempdips on the following approximate dates
- May 15th-ish– just had this one in 2014
- June 10
- July 5
- August 12 and
- August 30

even during ‘hot years’ the tempdips appear…
The tempdips are interesting to see graphically and something that we don’t normally recognize as the temp, humidity, dew point, heat of Alabama summer don’t normally make them that recognizable. But based on the past 10+ years, they happen and are probably just cool/cold fronts occurring. It’s the relative regularity and timeliness of them that are remarkable and seem to create a pattern.
Some of my next posts will get more into my theory on ‘Heliocentric Climate Seasons.’ It’s pretty ‘cool’ stuff and may help explain ‘climate change.’ But in the meantime let’s wait and see what happens this year with our ‘tempdips.’
If you have any questions or comments about this, please reach out to me via Facebook and my weatherwalrus page there…https://www.facebook.com/weatherwalrus